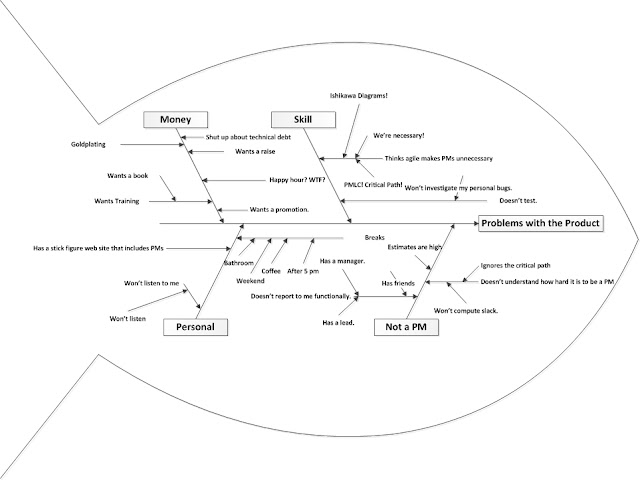
* Our PM created an Ishikawa Diagram to show me where our product is going wrong.
Well...this is totally expertimental. An Ishikawa diagram for the Snarky developer as created by his Project Manager. I think it probably needs to be absolutely huge to read. There's not really such a thing as an uncluttered Fishikawa Diagram. This is what comes of a week in PMP training. I thought about putting the Snarky developer in the center, but then there wasn't room for text. And I thought about putting the grumpy thought bubble off the top of the fish, but that just looked like he was trying to breathe and failing and that's sort of sad. If it doesn't allow click through to view the whole thing in a reasonable size, I'll Flickr it and make it huge and update.
If you're not familiar with Ishikawa Diagrams or Fish Diagrams or Fishikawa Diagrams, a simple search of Google will turn up many examples and Wikipedia has a good article.
Ishikawa diagrams (also called fishbone diagrams, herringbone diagrams, cause-and-effect diagrams, or Fishikawa) are causal diagrams created by Kaoru Ishikawa (1968) that show the causes of a specific event. Common uses of the Ishikawa diagram are product design and quality defect prevention, to identify potential factors causing an overall effect. Each cause or reason for imperfection is a source of variation. Causes are usually grouped into major categories to identify these sources of variation. The categories typically include [Wikipedia goes on to list the categories...]


No comments:
Post a Comment